
Status : Completed
Tags: opencv python tkinter yolov8
To analyze various aspects of Indian traffic and derive required parameters from its analysis which helps in calculating the quantitative requirements of roads.
python
opencv
tkinter
yolov8
This is a project based on computer vision, ML and DL, it is aimed to analyze various parameters of Indian traffic and facilitates required by the civil engineers to derive required parameters from traffic analysis which helps in calculating quantitative requirements for road upgradation and traffic flow analysis by avoiding laborious work and also for various other different applications.
In this project the traffic analysis is divided into two parts:
|
Here the volume of the traffic flow is analyzed and peak hour factor is measured |
|
Here the rate of the traffic flow is analyzed and percent cumulative frequency distribution graph is plotted from collected data |
Autonomous Traffic Analysis System is a software program that will take real-time vehicle data from the camera and convert the data into interactive charts and calculate required parameters like percentile speed and other important parameters.
The data collected for traffic volume studies and spot speed analysis which facilitates in determining the :
etc.
Tech Stack:
Python
Approach:
There are multiple methods and models to detect the objects so selecting the most appropriate model is an essential task for a project. YOLO V8 has been used in the project which works on neural networks and the recent 8th version has best efficiency when compared to other models available in the community. Haar Cascade is another ML based model which is helpful in detecting objects but the efficiency is less when compared to YOLO.

Detected vehicles are enclosed in a bounding box.
Detected vehicles are given ID’s and their type is also detected and shown over the bounding box.

Detecting and differentiating whether the vehicle detected is a car, bike, bus or a truck.
The Indian vehicles are classified into 4 categories:
YOLO object detection model for detecting vehicles and a custom implementation of the BYTE Tracker algorithm for tracking the detected vehicles. The video is read frame by frame using the supervision library, and the detection and tracking algorithms process each frame.

The speed of the vehicles has to be detected in spot speed analysis. In speed detection, the Haar Cascade method is used to detect the vehicles and then we are measuring the time taken by the vehicle between any two points on the road. Since we already know the distance between the two points so speed=distance/time. This algorithm reads a video file of a traffic scene, detects and tracks vehicles using a Haar cascade classifier and a correlation tracker, and estimates the speed of the vehicles based on their movement between consecutive frames.
Traffic Volume is defined as the number of vehicles passing a section of a lane or roadway during a given time interval. Traffic volume studies are conducted to determine the number, movements, and classifications of roadway vehicles at a given location. We count the number of vehicles in a given time interval and then convert them into their respective PCU (Passenger Car Units) which are traffic variables (such as headway, speed, and density) compared to a single standard passenger car and calculate the volume and peak hourly factor and the data can be presented and analyzed by plotting graphs

This is a statistical analysis of data we collected from speed detection. In speed detection, we collected the vehicle's number and their speed in an Excel file, now the spot speed Algo. will plot related graphs of the given data. For spot speed analysis we used the matplotlib library of Python.
Graph 1: Speed vs Frequency.

Graph 2: Speed vs Cumulative Frequency.

This analysis will give values like Mean Speed, Median Speed, Mode Speed, and standard deviation of speeds of vehicles.
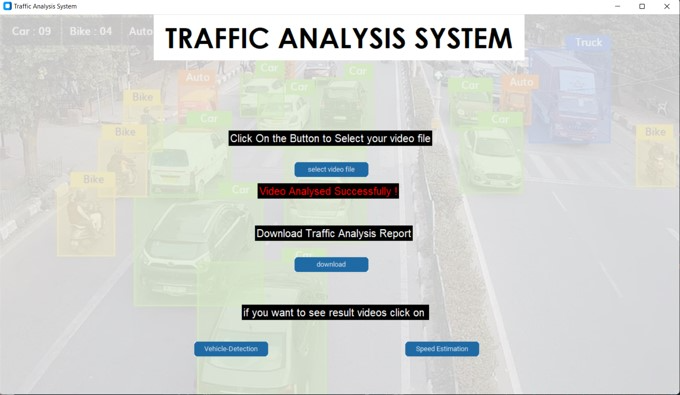
Our GUI has Following features:
Parameters derived:
Peak hour factor:
Peak Hour Factor (PHF) is a ratio used to estimate the amount of traffic during the peak hour of a day. It is important in transportation planning and engineering for capacity analysis, traffic signal timing, transit planning, and environmental impact assessment. PHF helps identify bottlenecks, optimize traffic flow, and inform decisions about roadway improvements and public transportation services.
Percentile speed:
Percentile speed is a measure used in transportation planning and engineering to describe the distribution of vehicle speeds at a particular location or segment of a roadway. It is useful for determining design speed, identifying areas where speed management measures are needed, assessing safety, monitoring performance, predicting traffic flow, comparing roadway designs, and promoting safe driving practices. Incorporating percentile speed data into traffic models helps transportation planners predict the effects of new roadway projects or changes in traffic management measures. Ultimately, percentile speed helps improve roadway safety and efficiency.
Problems Faced
Applications:
The project finds a large spectrum of real-life areas of application
Future Scope:
The system developed in this project has a lot of potential for future expansion and improvement.
Source Code
Github:https://github.com/roboclub-mnnit/Autonomous_traffic_analysis_system-2022-23-Project
Resources
Python: https://docs.python.org/3/library/tkinter.html
OpenCV: https://docs.opencv.org/4.x/d6/d00/tutorial_py_root.html
Tkinter: https://docs.python.org/3/library/tk.html
YOLO v8: https://github.com/ultralytics/ultralytics
Project members:
|
Name |
Branch |
Registration number |
|
Priyansh Lohiya |
Electronics and Communication Engineering |
20215109 |
|
Aayush Verma |
Electronics and Communication Engineering |
20215056 |
|
Priyanshu Maurya |
Electrical Engineering |
20212021 |
|
Rishi Mishra |
Electronics and Communication Engineering |
20215096 |
Mentors:
|
Name |
Branch |
Registration number |
|
Kandukuri Yaswanth |
Civil Engineering |
20201057 |
|
Anurag Gupta |
Electronics and Communication Engineering |
20195168 |